When fleet managers talk about depreciation, the conversation usually defaults to straight-line book value — purchase price divided by expected years of service. It is neat, it satisfies the accounts team, and it is almost entirely disconnected from what your vans are actually worth on the used-vehicle market at any given point in their life.
The gap between book value and actual residual value is where disposal decisions go wrong. Understanding how commercial van depreciation really curves — and how mileage, condition, and vehicle type affect that curve — gives you a sharper basis for timing hold-versus-dispose calls across your fleet.
How van depreciation curves differ from cars
The depreciation pattern for a commercial van is meaningfully different from a passenger car, and fleet operators who carry car-based assumptions into their van disposal strategy tend to over-hold or under-hold their assets.
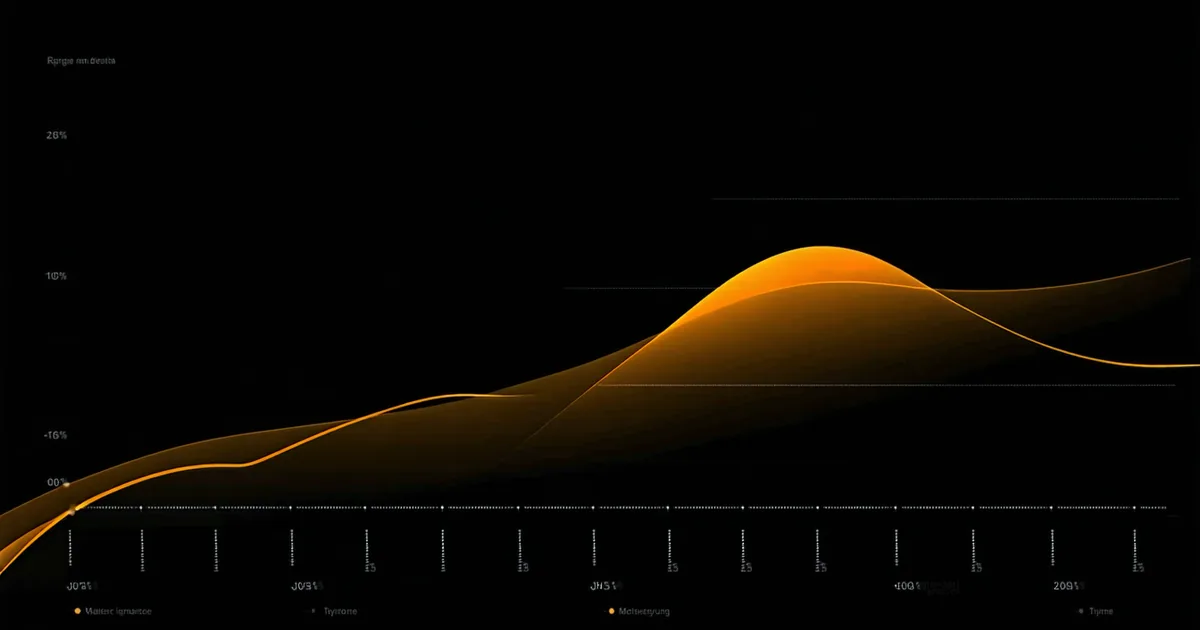
For a typical mid-range panel van — think a Ford Transit Custom or a Vauxhall Vivaro — the sharpest value loss occurs in the first 36 months. A van purchased new at £28,000–£32,000 can realistically be worth 45–55% of purchase price at three years, subject to mileage and condition. That rate of decline is steeper than most straight-line depreciation schedules assume.
From year three through to year five or six, the curve flattens considerably. The van is now trading in the active used-commercial market where buyers are less sensitive to age and more sensitive to condition, mileage band, and service history. A well-maintained van at 80,000 miles in year five is frequently worth only marginally less than the same van at 60,000 miles in year four — the additional mileage has a smaller marginal impact on price than the initial registration-age discount did.
Beyond year seven, the curve steepens again — mechanical reliability concerns, emissions-related taxation changes, and reduced buyer confidence in service history completeness all apply downward pressure. The plateau in years four to six is the window where holding has relatively lower residual cost.
What mileage bands actually do to residual value
The used commercial van market broadly applies mileage bands as a pricing gate rather than a continuous sliding scale. The practical thresholds shift over time, but the structure is consistent: a van that crosses a key mileage threshold — commonly around 80,000 and again around 120,000 miles — drops into a lower buyer tier and is priced accordingly.
This creates a disposal timing incentive that is separate from age. A three-year-old Transit approaching 80,000 miles is worth materially more before that threshold than after. If your telematics data shows a vehicle is running at, say, 2,800 miles per month and is currently at 74,000 miles, you have a narrow window to dispose ahead of the threshold. Waiting another three months means crossing into a lower valuation band.
We're not saying high-mileage vans should always be disposed early — there is a reasonable operator argument for running high-utilisation vehicles through to a second major service life if R&M costs are controlled. The point is that timing disposal relative to mileage band thresholds, rather than simply by calendar age, often produces better net realisations.
For a 200-vehicle fleet, even a modest improvement in average disposal timing — capturing 3–5% better residual per vehicle — can represent a five-figure improvement in annual fleet disposal revenue across the cycle. It is not a dramatic number per transaction; it compounds across volume.
Using CAP HPI and Glass's Guide correctly
CAP HPI and Glass's Guide are the two dominant commercial residual value references in the UK market. Both publish monthly valuations by make, model, derivative, age, and mileage. Both are used by dealers, finance houses, and fleet disposal specialists to price vehicles.
The common misuse in fleet operations is treating these guides as disposal price targets rather than market benchmarks. A CAP Clean or a Glass's Retail figure represents what a well-presented example of that vehicle might achieve through a retail channel — not what your fleet van will net at trade auction after three years of commercial use.
The practical application is to use CAP HPI or Glass's trade/fleet values — not retail — as a baseline, then adjust for condition against the relevant condition guide. A van with a documented service history, tyres within the legal limit, and no unrepaired bodywork will achieve trade values close to the guide figure. A van with incomplete service records, worn tyres, and cab damage will sit 8–15% below. Understanding where your vehicles sit on that range before disposal is straightforward if your maintenance records are current per VRM.
Checking guide values quarterly, rather than only at disposal, also gives you an early-warning signal for market moves. Commercial van residuals are more sensitive to economic conditions and fuel cost shifts than car residuals — the 2020–2022 period of constrained new vehicle supply saw used van values inflate unusually; the subsequent normalisation caught operators who had based hold decisions on that inflated baseline.
The EV van residual value problem
Battery electric vans — Vauxhall Vivaro-e, Ford E-Transit, Renault Kangoo E-Tech and similar — were purchased in growing numbers by UK fleets through 2022–2024, partly supported by the Plug-in Van Grant (which closed to new applications in mid-2023 for most categories). The residual value picture for these vehicles is currently much less settled than for equivalent diesel vans.
Several factors are working against EV van residuals in the used market: battery degradation uncertainty, rapid evolution of charging infrastructure, and the rate at which newer battery technology makes current-generation vehicles feel dated. CAP HPI and Glass's Guide both carry EV van valuations, but the market data underpinning those figures is thinner than for diesel equivalents, and the forecast uncertainty bands are wider.
Operators who purchased EV vans primarily for fuel cost savings should be cautious about how they model disposal value. A prudent approach is to apply a wider confidence interval to EV van residuals — perhaps 10–15 percentage points wider than for comparable diesel — when building a TCO model. This is not a reason to avoid EV vans; total running cost including fuel and servicing differences may still favour them on appropriate duty cycles. It is a reason to be explicit about the uncertainty rather than treating guide values as reliable for disposal planning in the same way diesel guide values are.
Per-VRM residual modelling in practice
A 220-vehicle fleet operating in the East Midlands recently ran a disposal review after several years of calendar-based cycling — replacing vehicles at 48 months regardless of mileage or condition. When per-VRM residual data was introduced, the analysis showed that a cohort of 31 vehicles had already crossed the 80,000-mile threshold within their 48-month cycle, while another cohort of 18 had reached 48 months with only 55,000–65,000 miles on the clock. The first group was being held past optimal disposal point; the second was being disposed before it had run through its most cost-efficient operating window.
Adjusting the cycling policy to a mileage-and-condition trigger — rather than a pure age trigger — produced different disposal timings for most of the fleet, with vehicles cycling out either earlier or later than the uniform 48-month schedule depending on utilisation. The net effect on fleet disposal income and R&M cost in the subsequent cycle was meaningful, though the exact figures will vary by fleet composition and market conditions at time of disposal.
The barrier to per-VRM residual modelling is rarely conceptual — most fleet managers understand the principle immediately. The barrier is data: mileage from telematics, condition from inspection records, and current guide valuations all need to be assembled per registration mark rather than averaged or estimated. Once that data assembly is automated, the hold-versus-dispose decision becomes a structured review rather than an approximation.