Stop averaging your fleet costs.
Start seeing per-VRM TCO.
ExoFleets maps fuel spend, R&M cycle, residual depreciation and telematics-flagged abuse events to the individual vehicle registration mark. Not a fleet-wide average. Not a driver score. The chassis.
Your fleet report says 14.8p/mile. But which 23 vehicles are burning 22p?
Averaged fleet cost figures hide the high-cost tail — the three-year-old vans with chronic brake pad cycles, the drivers with cold-start abuse patterns, the vehicles whose residual has already cratered.
Fleet managers are not short of telematics data. What they're short of is a single view that ties fuel card transactions, CAN bus events, service records and DVLA MOT history to the one thing that matters: the individual chassis. ExoFleets is that view.
Fleet average report
14.8p/mile
All 200 vehicles combined. Looks fine.
Per-VRM breakdown
Everything that makes up true per-vehicle TCO
Fuel cost by VRM
Pence-per-mile calculated from telematics odometer readings cross-referenced with fuel card transactions. Each vehicle's figure is independent — not diluted into a fleet average.
R&M cycle tracking
Brake pad cycles, tyre intervals and scheduled service windows tracked per chassis against mileage accumulation. Flags vehicles entering the phase where unscheduled downtime risk rises.
Residual depreciation curve
Per-VRM depreciation modelled from age, accumulated mileage, condition flags and DVLA MOT history. Tells you whether disposal now or in six months is the lower-cost decision.
Telematics abuse flags by VRM
Cold-start over-revving, harsh braking events and excessive idling detected from CAN bus and GPS feed. Attributed to the vehicle, not just aggregated into a driver score that gets ignored.
Cost export & scheduled reports
Per-vehicle cost sheets in CSV or PDF. Scheduled monthly VRM digest to finance. Weekly abuse flag summary to fleet ops. You decide the cadence and recipients.
UK GDPR-compliant data pipeline
Driver IDs pseudonymised at ingestion. All fleet data stored on AWS eu-west-2 (London). ICO-registered data controller. Processing under UK GDPR Article 6(1)(b) and (f).
How ExoFleets turns telematics data into per-vehicle cost
01
Connect your telematics feed
Webfleet by TomTom, Samsara CSV export, Geotab MyGeotab export, or generic NMEA/OBD upload. First connection takes under 30 minutes. No hardware changes.
02
Anchor every event to VRM
Each fuel event, GPS ping, CAN diagnostic and service record is anchored to the individual registration mark — not to the driver, the depot or the route. When a vehicle changes driver, its cost history stays with the chassis.
03
Per-mile cost card for every VRM
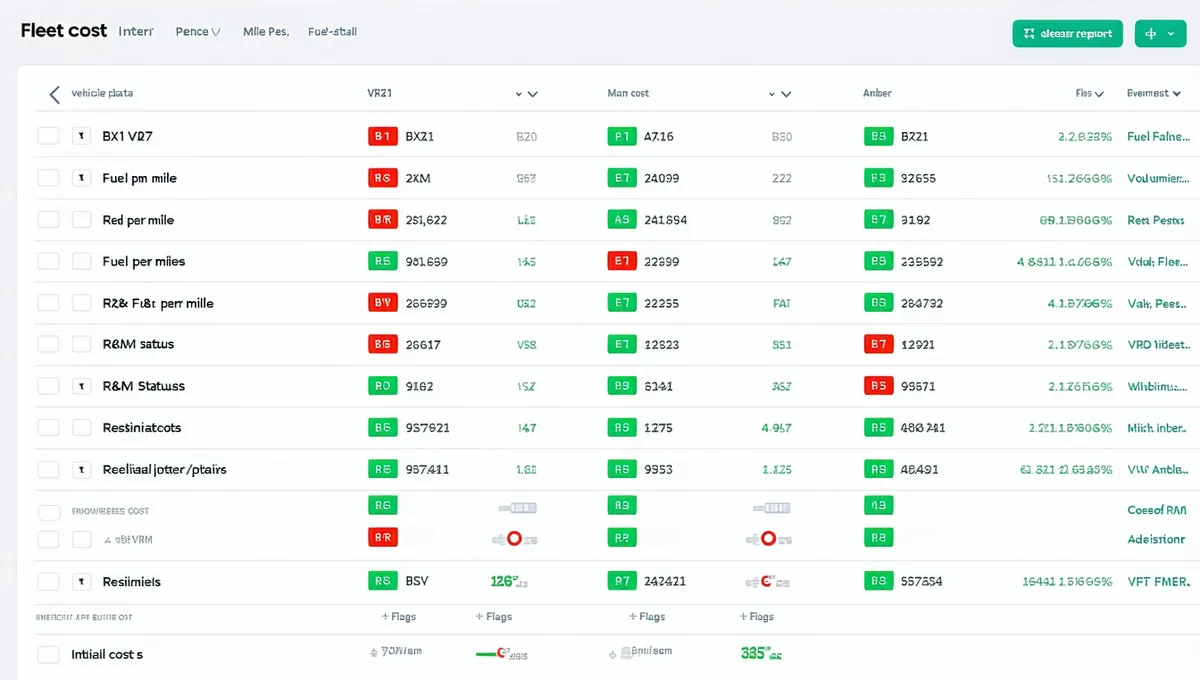
Live dashboard updated daily. Scheduled PDF and CSV reports on your cadence. Fuel p/mile, R&M status, residual curve, abuse flag count — per vehicle, not per fleet.
What fleet managers say once they stop using averages
"We'd been looking at average p/mile for three years. ExoFleets showed us in the first week that seven of our Transits were costing 40% more per mile than the rest. We would never have found that from a spreadsheet or the Webfleet dashboard summary."
"The residual depreciation view alone paid for the subscription. We held three vehicles six months longer than planned because the curve showed they had not hit the cost inflection point yet. That is not a decision you can make from a fleet-average depreciation charge."
See what your fleet actually costs — by VRM, not by average
Book a 30-minute demo. We connect to a sample of your Webfleet, Samsara or Geotab export and show you the per-VRM cost variance your current reports are obscuring.