How ExoFleets turns telematics noise into per-VRM cost clarity
A three-stage pipeline from raw telematics feed to per-mile breakdown by vehicle registration mark.
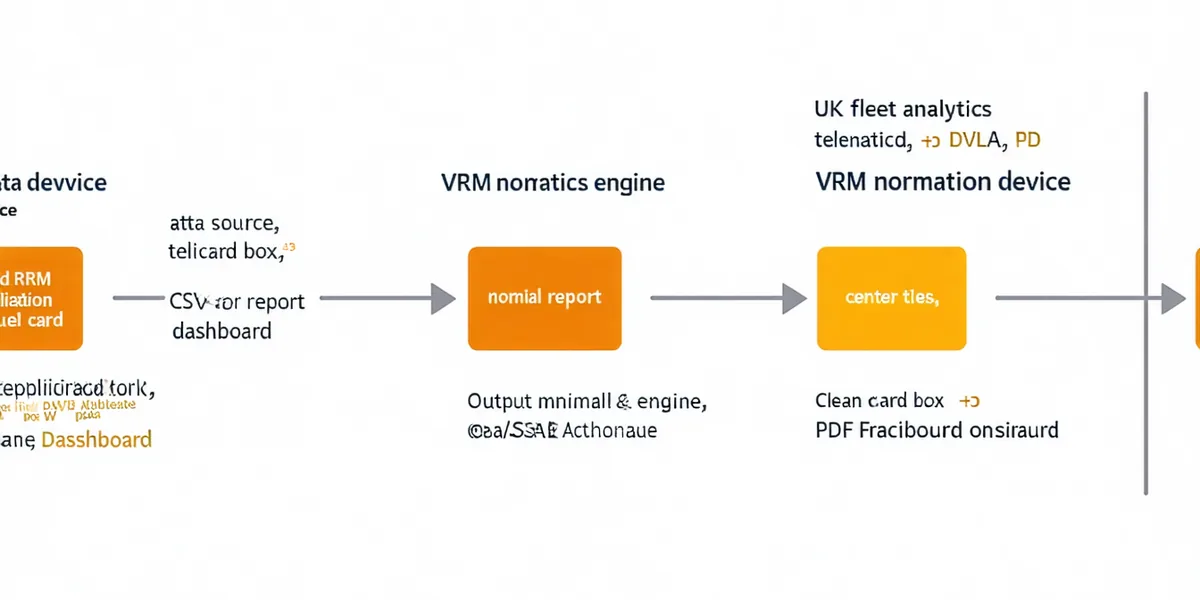
The three stages explained
Connect your telematics feed
You point ExoFleets at the telematics system your fleet already uses. No hardware changes. No new tracking devices fitted.
Webfleet by TomTom: Scheduled daily API sync or manual CSV export. Covers position, ignition events, mileage, driver ID.
Samsara: Fleet report CSV export. Vehicle fault data, harsh-event flags, fuel sensor data where fitted.
Geotab / MyGeotab: Report exports for trip data, engine diagnostics, fault codes.
Generic NMEA / OBD upload: Manual CSV with VRM, date, odometer, event type columns.
Normalise by VRM
Every data point — fuel event, GPS ping, CAN diagnostic, service record — is anchored to the individual vehicle registration mark. Not to driver ID, not to route, not to depot zone.
Deduplication: Overlapping records from multiple data sources are merged without double-counting mileage or events.
Anomaly detection: Statistical outliers flagged for review — sudden fuel consumption spikes, odometer resets, GPS gaps during operational hours.
Driver anonymisation: Driver IDs are pseudonymised at ingestion. Cost analysis proceeds by VRM, not by named individual — UK GDPR by design.
Per-mile breakdown delivered
Live dashboard updated each time new telematics data comes in. Scheduled PDF and CSV reports sent to fleet managers and finance teams on your cadence.
Per-VRM cost card: Fuel p/mile, R&M status, residual depreciation %, abuse flag count — for every active VRM in your fleet.
Fleet cost distribution: Histogram showing your cost spread from lowest to highest cost vehicle. Identifies the high-cost tail immediately.
Scheduled reports: Monthly VRM digest to finance. Weekly abuse flag summary to fleet ops. Configurable recipients and formats.
Setup time
<30 min
From telematics connection to first per-VRM cost card
Data latency
Daily refresh
Telematics data processed and mapped to VRM overnight. Live abuse flags updated in real time where API access is available.
Data history
24 months
Historical telematics retained in the per-VRM model. Enables depreciation curve calculation and seasonal cost trend analysis.
Telematics sources we work with
No hardware changes required. ExoFleets ingests from the systems your fleet already uses.
Webfleet by TomTom
API · CSV export
Samsara
CSV export
Geotab / MyGeotab
CSV · Report export
Generic NMEA / OBD
CSV upload
The VRM-first data model
Every reading — fuel event, GPS ping, CAN diagnostic, service record — anchored to VRM, not to driver ID or route.
Most telematics platforms record events by driver, by route, or by time window. ExoFleets re-anchors every event to the chassis — so when a vehicle changes driver or moves between depots, the cost history stays with the vehicle.
This means residual depreciation, R&M cycles and fuel consumption trends follow the vehicle through its operational life, regardless of how many drivers it has had or how many times it has been reassigned.
See what the pipeline produces for your actual fleet
Book a 30-minute walkthrough. We connect to your Webfleet, Samsara or Geotab export and produce a per-VRM cost card for a real sample of your vehicles — so you can judge the output before committing to a trial.